
Reading time: 4 min 2 sec
COVID19 has almost put a pause on our everyday life; quiet roads, vacant parks, closed theatres, silent supermarkets, and the list goes on. To resume our life back to normal, it is inevitable to develop meaningful and scalable medical and technological solutions asap. In general, medical solutions such as vaccinations and other popular treatments can help our immunity system to cure diseases. Additionally, solutions that are based on modern technology also play a crucial role in understanding and preventing diseases. Identifying and implementing novel technological solutions such as predictive models, AI-based algorithms, and various other tools are potential game-changers. Perhaps the most essential component in developing any such technological solution is the data that is already available. Data is the fuel for many algorithm-engines to function correctly. Availability of relevant data enables people to do various forms of computational analysis of COVID19 situation. Although many reliable and up-to-date data sources are available for front-line researchers, many newbies in programming, who wish to apply their own ideas on the COVID19 data are generally unaware of how to get the real-time data. This tutorial is meant for those beginners.
“Data is the fuel for many algorithm-engines to function properly.”

Today, we will see how to import COVID19 real-time data directly into your Python workspace. Skilled programmers can easily perform this by writing their own chunk of code to extract the data from the web. But when beginners try to access the data from the web, they usually stuck at some point because the web data is either static (such as .xml files that are not automatically updatable) or encoded. Here, we are going to use a tiny python package called COVID19Py (License) wrapped with rich inbuilt functionalities. It directly fetches data from three primary sources, (i) Johns Hopkins University Center for Systems Science and Engineering, (ii) Conference of State Bank Supervisors and (iii) The New York Times. As the data is imported as nested dictionaries of Python, data manipulation, visualization and post-processing are effortless and intuitive. For more details about the package, please click here. OK, enough is enough, let’s dive into the complete code:
# -*- coding: utf-8 -*-
"""
Created on Wed May 6 19:31:55 2020
@author: Dileep Kottilil
Language: python 3.7.2
"""
import COVID19Py # main package
import matplotlib.pyplot as plt #plotting library
from datetime import datetime # package to convert date strings to datetime objects for plotting
# Fetching and extracting data
covid19 = COVID19Py.COVID19(data_source="jhu") # Data source is chosen as Johns Hopkins University
location = covid19.getLocationByCountryCode("IN",timelines=True) # Latest data from the location: Eg., India
loc = location[0] # Parent dictionary
confirmed = loc['timelines']['confirmed']['timeline'] # Extract confirmed cases from the parent dictionary
deaths = loc['timelines']['deaths']['timeline'] # Extract death cases from the parent dictionary
# Converting date string into datetime objects for plotting purposes
dates = [w[0:10] for w in list(deaths.keys())] #slice the original date format to required format
DATE = [datetime.strptime(x,'%Y-%m-%d').date() for x in dates] # Create datetime object
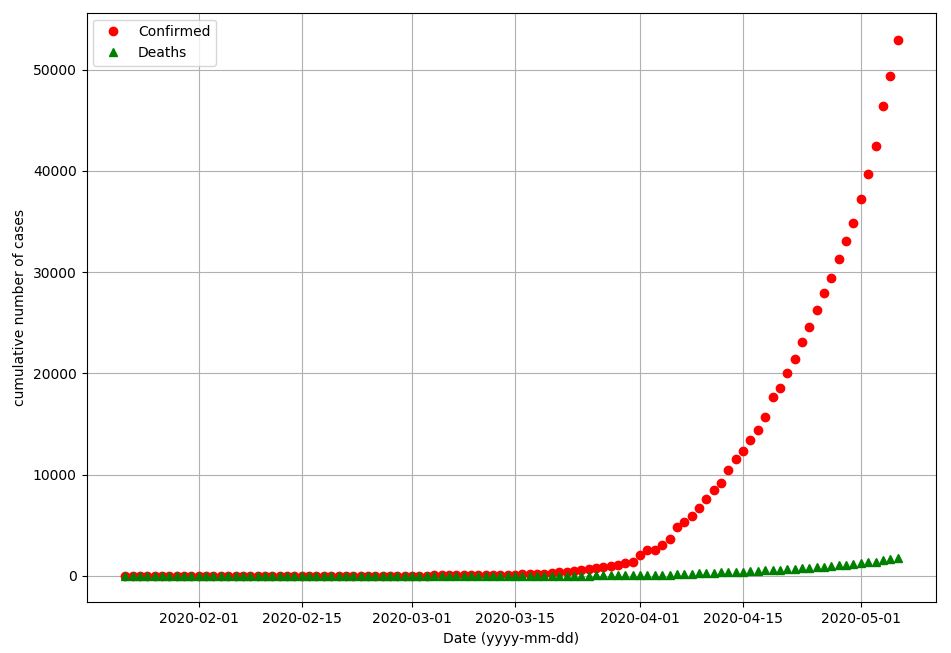
# Basic data visualization
line1 = plt.plot(DATE,list(confirmed.values()), 'ro', label = 'Confirmed')
line2 = plt.plot(DATE,list(deaths.values()), 'g^',label = 'Deaths')
plt.legend()
plt.xlabel('Date (yyyy-mm-dd)')
plt.ylabel('cumulative number of cases')
plt.tight_layout()
plt.show()
Once you get your required data, you can start working on your own analysis and modelling. You can import the most recent data whenever you run the code. Who knows where the best solutions come from? Maybe the solution is within you. So, what are you waiting for? Use the above code for your own models. You are free to cut, copy or modify the code for any purposes. Let’s overcome this hard time together.
If you like this article, please hit the like button and comment. Don’t forget to share this informative article. Happy coding!
